
WITNESS RADIO MILESTONES
The 2015-16 Affordability Report
Everyone should have access to the Internet. So concluded the 193 member states of the United Nations when they agreed on a new set of Sustainable Development Goals (SDGs) in September 2015. Underscoring the potential of the Internet to contribute to global development and empowerment, SDG target 9c calls for universal and affordable access in the world’s least developed countries by 2020.
Intended as a contribution to help leaders set us on a path to achieve this goal, the 2015-16 Affordability Report looks at the affordability environment across 51 countries, considers the effects of poverty and income inequality and takes a close look at gender inequality in access.
The Affordability Drivers Index
Our Affordability Drivers Index (ADI) looks at the policies, incentives, and infrastructure investments in place across 51 developing and emerging countries, and assesses the extent to which they are being implemented. This includes policies which we believe drive progress towards more affordable Internet. Countries that do well on the ADI also tend to have lower broadband prices for their citizens, although the ADI does not measure price directly.
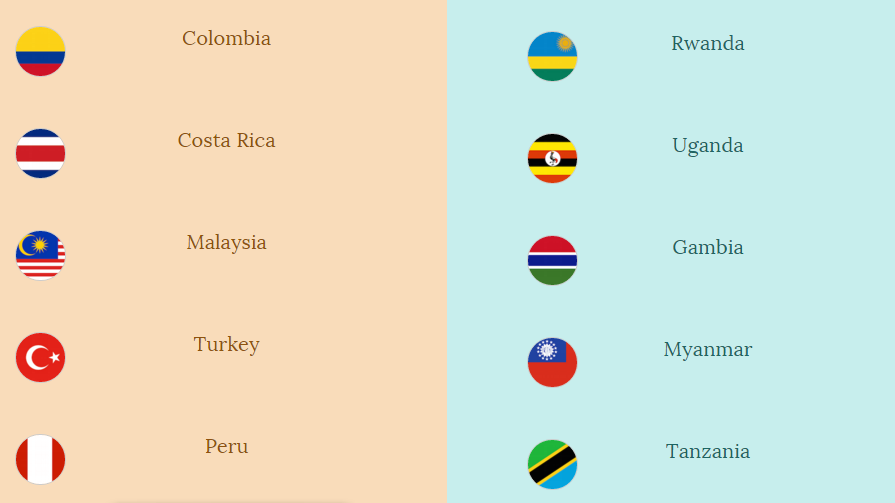
| Top 5: Overall ADI Rankings | Top 5: Least Developed Countries |
|---|---|
 Colombia Colombia |
 Rwanda Rwanda |
 Costa Rica Costa Rica |
 Uganda Uganda |
 Malaysia Malaysia |
 Gambia Gambia |
 Turkey Turkey |
 Myanmar Myanmar |
 Peru Peru |
 Tanzania Tanzania |
Colombia and Costa Rica once again top the rankings, with scores that reflect improved infrastructure and access indicators. Myanmar achieved the largest jump in its ADI ranking, moving up nine places to 27th position, thanks to the successful opening of the previously state-owned telecoms market to new operators (2013), and the recent introduction of broadband services (2014). However, on the whole, scores on the ADI are low, meaning much hard work lies ahead for countries to create the right environment to drive prices down and connection rates up.
Poverty and inequality
Despite falling prices, not one of the 51 countries included in our analysis has met the 5% affordability target for those living in poverty. This is not an issue affecting small numbers of people — 1.9 billion people in the countries covered by the ADI live in poverty (i.e., under $3.10 per day).
Income inequality also plays a role, and may make progress appear faster than it is. Although 25 of 51 countries have met the UN’s 5% affordability target for those earning the average national income, just nine of these countries meet the affordability target for the bottom 20% of income earners. The means that millions continue to be priced out of the digital revolution in countries which have met the 5% target. However, when costs drop to 2% or less of monthly incomes, access tends to be affordable for all income groups.
While the report does not consider device costs in detail, it does note that the cost of getting an internet-enabled phone can play a large role in determining who can afford to be online. When we add the price of a hypothetical low-cost US$48 smartphone to the price of a 500MB broadband plan, the total population in almost all countries that can actually afford both a broadband plan and a low-cost smartphone drops by 20%. We also note that 500MB per month offers only very limited opportunities to use the Internet meaningfully.
The gender gap in access
As stark as the affordability picture appears for those living in poverty and at the bottom of the income pyramid, the cost to connect is even higher for women in these groups. The gender wage gap diminishes the ability of women — and female-headed households in particular — to afford Internet access. Recent research by the Web Foundation shows that poor urban women are 50% less likely to be connected to the Internet than men in the same age group with similar levels of education and household income.
SDG targets 9c (affordable universal access) and 5b (enhancing the use ICT to promote the empowerment of women) might be found under different overarching goals, but they are inextricably linked. Universal access cannot be achieved without concrete and focused efforts to bring women online, just as full gender equality cannot be achieved without enabling women’s access to an affordable, open, and safe Internet. Access to education, and skill building and training opportunities is key to support women’s effective participation in a digital society, and must be considered and integrated as part of a comprehensive strategy.
Recommendations
- Develop and work toward a more ambitious affordability target. We propose a new “1 for 2” target: 1GB of data priced at 2% or less of average monthly income.
- Reduce the cost of mobile phones and ICT devices. Governments must work to reform tax and patent regimes so that ICT device costs can come down. They will also need to incentivise the private sector to develop high quality, low-cost smartphones.
- Increase investment in and availability of public, subsidised access. There are always groups that will be excluded by the market and for whom access costs will still remain out of reach. Public access via libraries, community centres, and municipal WiFi schemes — funded by well-run Universal Service and Access Funds — is critical to deliver access to these populations.
- Create specific, time-bound targets to close the gender digital divide. Across much of the developing world, the gender gap in Internet use is staggering — for example, there is just one woman online for every three men online in Kampala, Uganda. Governments must set concrete targets to achieve gender equity in digital adoption, skills and empowerment, and back these with specific programs and budget allocations. Gender-disaggregated data must be collected to monitor progress. This should be done through more gender responsive national broadband planning.
- Integrated approach to policymaking. Getting everyone online requires balanced policies that address demand as well as supply; regulation as well as competition; fixed-line as well as mobile broadband; public access as well as individual subscriptions. Government ministers and others must spearhead efforts to convene all actors and develop a clear, coherent plan for sequencing reforms and stimulating the investments needed to enable reduced costs and wider access. Donors and aid agencies must come to the party with financial and practical support.
1
Introduction
“Everyone should have access to the Internet.” That was the agreement in September 2015, when the 193 member states of the United Nations agreed on a new set of Sustainable Development Goals (SDGs), which set the global development agenda for the next 15 years. With an explicit target in SDG 9c of universal and affordable access across the world’s Least Developed Countries (LDCs) by 2020, it implicitly assumes universal and affordable access1at the global level — access for everyone, everywhere by 2020. Yet on current trends, it will take LDCs nearly 30 years to reach this target.
To reach this goal will require bold action. Unless we dramatically accelerate progress, only 16% of people in the world’s poorest countries, and 53% of the world as a whole, will be connected by 2020. This connectivity lag will not only result in a huge amount of lost economic growth — it will also deny hundreds of millions of people access to education, health services, political voice, and employment opportunities through the Internet.
This report identifies critical barriers that must be overcome in just four short years to achieve the SDG connectivity target, and sets out the steps governments, regulators, businesses and civil society organisations must take now.
1.1The status quo
Today, over four billion people — some 56% of the world — are still not using the Internet. The majority of this offline population are women. Most live in LDCs and other developing countries.
One of the key obstacles countries face in the race to expand access is affordability — the vast majority of those without Internet access today are offline simply because they cannot afford a basic connection. For Norwegians, constant access to fast, uncapped broadband costs little more than the latte many buy every day on the way to the office. For Nigerians, just 500MB of mobile prepaid data can cost more than they spend on their children’s education.
The UN Broadband Commission defines broadband as affordable if an entry-level ( 500MB2) package is available at 5% or less of average monthly income (i.e., GNI per capita). Yet, in 2014, the average cost of a 500MB prepaid bundle was 15.2% of GNI per capita in LDCs and 6.5% across developing countries.
Internet prices appear to be dropping, and affordability, as defined by the UN, is increasing — last year the ITU reported that 67 out of 116 developing countries had actually achieved the UN’s 5% affordability target. Why, then, is growth in Internet use actually slowing? Use across the globe grew by 7.4% in 2014, but just by 6.9% in 2015.
1.2What is holding back progress?
This report argues that growth in connectivity is lagging due to the failure of policymakers to tackle the combined effects of poverty and income inequality.
While poverty on the whole is falling (both in absolute numbers and as a percentage of population), there are stillover two billion people living in absolute poverty across the developing world (i.e., on less than US$3.10/day), many of whom live in LDCs. For these people, affordable Internet access remains very far off indeed.
Economic growth in the developing world has not been evenly distributed. According to the UN, more than 75% of developing country households live today in societies where income is more unequally distributed than it was in the 1990s. When a few people earn a lot while others earn very little, the “average” per capita income — the benchmark the UN uses to assess affordability — will be much higher than what most people actually earn. In South Africa, for example, the average income is US$6,800 (GNI per capita, 2014) but 60% of the population actually earn less than half of that amount. In practice this means that a seemingly affordable mobile Internet connection (priced at 1.48% of “average” monthly income) actually costs the majority of South Africans anywhere between 6-19% of their income. The idea of a national “average” income is further skewed by gender inequality in earnings. This means that a nation can meet the UN’s top-level affordability target, but still see huge swathes of its people unable to afford to connect to the Internet. We explore these themes and their impacts in detail in Chapter III.
1.3The time for action is now
Time is short. In order to bring over four billion people online in under five years, we must act now, and at a scale and speed never seen before. Governments, the private sector, donors, and civil society must come together to take the bold steps that will enable those offline to afford and access a free and open Internet.
The digital divide is a poverty and gender divide. The very high cost of data and devices hits hardest those who earn the least, particularly women and rural dwellers. Unless specific steps are taken to make the Internet affordable and accessible to these groups, blanket initiatives to “connect everyone” risk deepening existing male/female and urban/rural disparities.
Achieving the universal and affordable access called for in SDG 9c will require specific and urgent measures to overcome the barriers presented by poverty and income inequality. These include:
- Develop and work toward a more ambitious affordability target. To achieve universal access, we must drive prices well below the current established target of entry-level (i.e., 500MB) broadband priced at 5% or less of average monthly income. We propose a new “1 for 2” target: 1GB of data priced at 2% or less of average monthly income.
- Reduce the cost of mobile phones and ICT devices. For Internet access to be affordable to those currently priced out, it is important to reduce device costs. Prices of mobile phones and other devices can be inflated by high import taxes and excessive patent and royalty fees. Governments must work to reform tax and patent regimes so that ICT device costs can come down, and will need to incentivise the private sector to develop high-quality, low-cost smartphones.
- Increase investment in and availability of public, subsidised access. A strong, competitive broadband market can go a long way towards driving prices down and — in tandem with cheaper devices — connecting the unconnected. However, there are always groups that will be excluded by the market and for whom access costs will still remain out of reach. Public access via libraries, community centres, and municipal WiFi schemes — funded by well-run Universal Service and Access Funds — is critical to deliver access to these populations.
- Create specific, time-bound targets to close the gender digital divide. Across much of the developing world, the gender gap in Internet use is staggering — in Kampala, Uganda, for example, there is just one woman online for every three men online. Yet acknowledgement of this digital gender gap is largely invisible in national broadband plans and in official statistics. Governments must set concrete targets to achieve gender equity in digital adoption, skills, and empowerment, and must support these targets with specific programmes and budget allocations. Gender-disaggregated data must be collected to monitor progress.
- Integrated approach to policymaking. Getting everyone online requires balanced policies that address demand as well as supply; regulation as well as competition; fixed-line broadband as well as mobile; public access as well as consumer affordability. This demands cooperation across ministries, between geographic units (local, state and national), and among private sector stakeholders, whose business interests may be very different. Government (e.g., the communications minister or the office of a head of state) must take the lead in convening these actors and developing a clear, coherent plan for sequencing reforms and marshalling the investments needed. Donor agencies and governments must support this process by stepping up investment in broadband infrastructure and low-cost connectivity models, as well as in digital skills, local content, and public access initiatives.
2
The Affordability Drivers Index (ADI)
Overcoming the affordability challenge is critical to achieving universal access. The technology to provide low-cost access is widely available, with new technological advances emerging all the time. Yet outdated or ill-conceived policies that artificially inflate costs — for example, by inhibiting competition or imposing cumbersome licensing requirements — contribute to prices that remain stubbornly high.
Efforts to expand access must be driven by a flexible, progressive set of policies and regulations that enable consumer prices to drop, quickly. What are these policies, who has them in place, and how are they working?
Our Affordability Drivers Index (ADI) looks at the policies, incentives, and infrastructure environment in place across 51 developing and emerging countries, including those policies which we believe drive progress towards more affordable Internet. It then assesses the extent to which these policies are being implemented. The ADI deliberately does not measure price directly — but there is a correlation between better scores on the ADI and lower broadband prices relative to income. In short, countries that do well on the ADI also tend to have lower broadband prices for their citizens, and are likely to be able to drive prices down further and faster in the future.
Though the past year has seen some marginal progress on the affordability front, the generally low scores across the board on the ADI show just how far we still have to travel on the road to universal access. On our current trajectory, we will not even come close to reaching the goal of universal access by 2020. Policy reform is a necessary and critical first step toward expanding access.
In this section, we look in more detail at what countries are doing to make Internet access more affordable for more of their people, and which of these policies seem to be working.
What is the Affordability Drivers Index?
This year, the A4AI Affordability Index has been renamed the Affordability Drivers Index (ADI). Why? We feel this name more accurately describes what the Index is measuring — that is, the combination of policy measures and other vital factors that determine how likely a country will be able to drive broadband prices down.
The ADI examines factors across two sub-index areas — infrastructure and access:
- The infrastructure sub-index measures the current extent of infrastructure deployment and operations, alongside the policy and regulatory frameworks in place to incentivise and enable cost-effective investment in future infrastructure expansion. Variables included in this sub-index include, for example, the amount of international bandwidth available in a particular country, and an assessment of a nation’s spectrum policy.
- The access sub-index measures current broadband adoption rates and the policy and regulatory frameworks in place to encourage growth and ensure provision of affordable and equitable access.This sub-index includes variables such as current Internet penetration rates and an assessment of the effectiveness of a country’s Universal Service Funds.
Each country is scored across a range of variables within each sub-index, and is then ranked against the other countries in the ADI, with the highest scoring country receiving a score of 100 and the lowest a score of zero. (Note: Although we gathered data for 88 countries, including developed nations, we only analyse developing and emerging nations; this is why Colombia, the top-ranked country on this year’s ADI only scores 65, not 100.) Higher scores indicate the existence of a combination of factors which contribute to lower industry costs and lower broadband prices, including high broadband penetration, sufficient infrastructure, and effective policies and regulations. (For more detail on the methodology used for the ADI, please see Appendix 1.)
Indeed, a higher ADI score is correlated with more affordable broadband Internet. This is illustrated in Figure 1, which shows that as the ADI score of a country increases, the price of a 500MB data plan relative to average income declines. This relationship also holds for a larger 1GB plan (Figure 2).
Figure 1. Relationship between ADI score and price of a 500MB prepaid, mobile plan (as a % of GNI per capita, 2014)
Source: ADI, Affordability Drivers Index
emerging
developing
Figure 2. Relationship between ADI score and price of a 1GB postpaid, computer-based plan (as a % of GNI per capita, 2014)
Source: ADI, Affordability Drivers Index
emerging
developing
This year’s ADI covers the same 51 countries included in our 2014-15 index and uses the same methodology as last year. However, while all the data sources were the same we did not conduct a new set of policy surveys for 2015. This was based on the assumption that policy and regulatory environments tend to change slowly, and was confirmed by a review of survey responses by several policy experts who participated in the 2014 survey (see Annex A). Thus, updates in ADI scores are based on new secondary data only.
| Rank 2015 | Country | Access Sub-index Score | Infrastructure Sub-index Score | ADI Composite Score | Rank 2014 |
|---|---|---|---|---|---|
| 1 | Colombia |
69.45 | 60.85 | 65.32 | 2 |
| 2 | Costa Rica |
78.88 | 50.00 | 64.60 | 1 |
| 3 | Malaysia |
69.57 | 56.69 | 63.28 | 4 |
| 4 | Turkey |
65.85 | 58.60 | 62.35 | 3 |
| 5 | Peru |
61.93 | 61.48 | 61.82 | 5 |
| 6 |  Brazil Brazil |
59.28 | 60.35 | 59.90 | 6 |
| 7 |  Morocco Morocco |
61.67 | 49.32 | 55.51 | 12 |
| 8 |  Mauritius Mauritius |
65.58 | 44.81 | 55.20 | 7 |
| 9 |  Mexico Mexico |
56.68 | 51.05 | 53.85 | 14 |
| 10 |  Argentina Argentina |
57.16 | 49.58 | 53.35 | 9 |
| VIEW MORE | |||||
emerging
developing
2.1Latin American nations top the rankings for the second year running
Latin American countries once again dominate the ADI rankings, with six nations of the region represented in the top 10. For most countries in the ADI top 10, changes in rankings were the result of gradual changes in the underlying indicators that make up the index. In some cases, these changes were more pronounced and were the result of improvements in the infrastructure sub-index scores. This was the case in Malaysia, which saw significant increases in fixed broadband speeds and international bandwidth per user, in Peru, where international bandwidth per user almost doubled, and in Mexico, which saw fixed broadband speeds increase significantly.
Colombia and Costa Rica again top the rankings, with scores that reflect improved infrastructure and access indicators. Both countries have approached the development and implementation of new ICT policy in a comprehensive manner, and affordability in both countries has improved — the price of a 500MB plan in Colombia fell to just over 3% of GNI per capita and to just 1% of GNI per capita in Costa Rica. Both have made improving access to the Internet a national priority and have partnered with the private sector to build out and share infrastructure, and to ensure a healthy, sustainable market. Each country faces the same overarching challenges to connectivity found in much of the world, including poverty and large rural populations, and have maintained a clear focus on enabling connectivity for these marginalised groups with digital skills and ICT training programmes and investment in locally created content.
2.1.1Colombia
Much of Colombia‘s success so far has been driven by government leadership in implementing effective policies and building partnerships within the ICT sector. Colombia’s 53% Internet penetration rate is among the highest of all countries covered in this report. This can be explained in part by the government’s multi-pronged strategy to improve affordability and access in the country. This strategy was outlined in the first phase of the “Plan Vive Digital” which was launched in 2010 and was described in our 2014-15 Affordability Report.
Some of the factors behind the success of the first phase of the plan include:
- Improving use of broadband through increased certification and training in digital literacy, support for teleworking, and improved e-government services;
- Better incentives for broadband adoption at all levels (such as eliminating customs tariffs and VAT on the purchase of PCs, subsidies for computers, and special subsidised tariffs for Internet access in low-income households);
- Promoting the development of the ICT sector through special loans to study ICT-related fields, a network of public labs for content creation, an enterprise network (apprenticeship programme for the marketing and development of applications), and alliances with regional governments to develop the local IT industry;
- Regulatory steps such as the promotion of infrastructure sharing, development of clearer rules for mobile virtual network operators (MVNOs), efforts to address market dominance, and elimination of “permanence” clauses (where customers were required to have a certain number of months on their contracts).
In 2014, the Colombian government launched the second phase of their broadband plan — “Plan Vive Digital II.” Two of the main goals of the new plan include: (1) making Colombia a global leader in the development of ICT applications for reducing poverty; and (2) making the government the “most efficient and transparent in the world” with regard to the use of ICTs. The plan’s explicit focus on improving the lives of the poor is a model of how ICT policies can be targeted for the benefit of specific groups in the population.
2.1.2Costa Rica
As with Colombia, much of Costa Rica’s success has been driven by government leadership. In Costa Rica, this high-level political will stems from a legal commitment to ICTs as a tool for fighting poverty, advancing human rights and promoting democratic participation. Costa Rica boasts one of the highest mobile broadband subscription penetration rates (44%) of all countries in this report, and also has one of the most affordable entry-level broadband plans (500MB), priced at just over 1% of GNI per capita. Approximately 50% of the country is online.
The work of the National Telecommunications Fund (FONATEL) has also been crucial to closing the country’s digital divide. FONATEL efforts have focussed specifically on: (1) connecting communities (e.g., through schools and community centres); (2) connecting households (including those of seniors, women entrepreneurs, the disabled, etc.); (3) connecting public sector organisations; and (4) establishing local WiFi networks.
The new Telecommunications Development Plan (Plan Nacional de Desarrollo de las Telecomunicaciones), developed through wide consultation, aims to increase Internet use to the average found within OECD countries, and to improve broadband speeds for at least 80% of the population to the median rate found in OECD countries.
2.2The foot of the table
The bottom of this year’s ADI looks much the same as the bottom of our 2014-15 index. While many of the 10 lowest ranking countries did better across several indicators, they did not improve enough to boost their overall ranking relative to other countries.
For the most part, these countries made most progress on the access sub-index. In Nepal, for example, the Internet penetration rate increased by two percentage points and the penetration of mobile broadband connections increased by approximately five percentage points (just below the index-wide average increase of 6.7 percentage points).
For countries such as Ethiopia and Burkina Faso, modest improvements in the access sub-index were undermined by declines or no changes in infrastructure sub-index-related indicators (e.g., international bandwidth and fixed broadband speeds). This lack of progress stems in part from the fact that much needed policy and regulatory reforms needed in both countries are yet to occur.
2.3Moving up the rankings: Myanmar, Mexico & Morocco
Myanmar achieved the largest jump in its ADI ranking, moving up nine places to 27th position. This move came as a result of the successful opening of the previously state-owned telecoms market to new operators (2013), and the recent introduction of broadband services (2014). (See box on Myanmar below for a more detailed discussion about recent changes there.) We expect Myanmar to continue to improve on the ADI as rapid changes in adoption and use are reflected in future analysis.
Myanmar: Rapid changes in an emerging market
Much has been made of the tremendous changes in the Myanmar telecommunications sector since the passage of the 2013 Telecommunications Law, which moved the country from a state-owned monopoly to a competitive market. Related reforms include the upcoming establishment of an independent regulator and the development of clear, transparent rules for the newly liberalised sector, based on international best practice.
In 2014, two new, private sector mobile operators (Telenor and Ooredoo) entered the market. There have since been significant decreases in the price of broadband services, with the price of a SIM card dropping from approximately US$150 in 2013 to just US$1.50 in 2015.
The tender process undertaken by the government to select the new two mobile operators was regarded as transparent and an example of international best practice. The government secured commitments from both new operators to invest heavily in the development of the country’s telecoms infrastructure. Ooredoo, for example, pledged to invest US$15 billion during its 15-year license period. amd Telenor has outlined plans to invest over US$1 billion in its first year of operation alone.The state-owned, incumbent service provider Myanma Posts and Telecommunications (MPT) has also entered into a partnership with the Japanese joint venture KDDI-Sumitomo to improve its infrastructure and operations and expand service.
The Telecommunications Law allows independent companies to develop towers and fibre infrastructure, so that the burden of infrastructure development no longer sits with mobile operators and government alone. Tower sharing has increased and costs have gone down.
Myanmar’s late entry into the ICT sector enabled it to benefit from lessons learned in other countries. Telecom companies leapt over older, outdated technologies, choosing to use and invest in 3G technology from the start, while the government has adopted progressive policies such as a unified licensing framework and promotion of infrastructure sharing by operators.
This has all led to a highly competitive and vibrant market. The telecom sector has become an attractive foreign investment destination, second only to the energy sector. Myanmar is witnessing an unprecedented uptick in broadband subscribers, spurred in part by the availability of more affordable smartphones. At the end of 2013, the total number of number of mobile broadband connections was 1.7 million; by the end of 2015, this number had grown more than 800% to 15.6 million3.
Despite this dramatic progress, the number now connected represent only 18% of the population4. Much more remains to be done. Priorities should include: a major roll-out of infrastructure over the next few years; addressing the limited reach of the electricity grid; improving the monitoring of compliance with licenses; increasing infrastructure sharing; and improving the country’s human and institutional capacity to meet these challenges. The A4AI-Myanmar Multi-Stakeholder Coalition is working to inform the government’s new Telecommunications Master Plan and to maintain the momentum seen over the past few years so that affordability can improve and access can expand.
Morocco and Mexico both entered the top 10 this year, each rising five spots in this year’s ADI rankings. Mexicostarted to see the fruits of changes to its ICT sector policies and practices, many of which are line with best practices outlined by A4AI. Following the passage of a new telecommunications law in 2014, Mexico introduced service- and technology-neutral licensing, increased public consultation in the rulemaking process, and is planning to launch an open-access 700MHz network in 2018.
Morocco’s rise in the rankings was largely due to improved infrastructure and to the results of reforms that began two decades ago. These early institutional reforms included the creation of the regulator, Agence National de Réglementation des Télécommunication (ANRT), and a plan for the liberalisation of the sector. This led to the eventual privatisation of Maroc Telecom (the government-owned incumbent), the early launch of 3G services, and the market entry of two new operators (INWI and Medtel). These developments occurred well ahead of other countries in the Middle East and North Africa (MENA) region.
In fact, Morocco has one of the more advanced and effective telecoms regulatory systems in the MENA region. The country has implemented a reasonably transparent licensing regime that allows for additional licensing options, thereby increasing competition at different levels of service. In 2012, the government launched a ten-year National Broadband Plan with the goal of ensuring access to fixed or mobile broadband for the entire population by 2022. The broadband plan also includes specific guidance on the allocation of spectrum for both licensed and unlicensed wireless broadband services. A year after launching the new broadband plan, the ANRT established a new national frequency plan, which addresses migration and allocation of spectrum for new broadband uses. In 2015, the ANRT issued calls for new 4G licenses, utilising available spectrum. By the end of 2015, approximately 19% of the population were mobile broadband subscribers5.
While mobile remains the dominant form of broadband access, in 2015 the ANRT decided to incentivise competition in fixed broadband. Currently, the fixed broadband market in Morocco is primarily controlled by one company, Maroc Telecom; the ANRT’s new decision will allow other service providers to provide fixed broadband services directly to customers, using the incumbent’s infrastructure.
2.4Affordability in the world’s Least Developed Countries (LDCs)
The overall ADI rankings presented above group all 51 countries together regardless of their diverse economic contexts. This year, given the SDGs explicit focus on the world’s least developed countries6, we’ve chosen to take a closer look at just this cluster of countries.
| Country | Access Sub-index Score | Infrastructure Sub-index Score | ADI Composite Score | 2015 ADI Rank |
|---|---|---|---|---|
| Rwanda |
54.42 | 51.90 | 53.13 | 11 |
| Uganda |
56.53 | 42.44 | 49.40 | 16 |
| Gambia |
49.12 | 42.81 | 45.82 | 20 |
| Myanmar |
31.88 | 53.67 | 42.57 | 27 |
| Tanzania |
43.90 | 40.38 | 41.93 | 30 |
Rwanda is the highest ranked LDC in this year’s ADI. Its success is due, in part, to the ambitious policies the country is pursuing. The SMART Rwanda Master Plan 2015-2020, builds on the previous National Information and Communication Infrastructure (NICI) plans, and puts ICTs — especially broadband — at the heart of the national socio-economic development agenda. The plan highlights public-private partnerships as a vehicle for achieving these goals, and lays out proposals for improved programme implementation and monitoring and evaluation.
Recent market developments in Rwanda look promising. In November 2014, Olleh Rwanda Networks (a joint venture between the government and Korea Telecom Corporation) launched an open access 4G LTE network; using this network, Airtel Rwanda was able to start offering 4G LTE services to customers that same month.
Rwanda is catalysing ICT efforts further afield, at subregional and regional levels. The government is leading and hosting the secretariat of the Smart Africa Alliance — an initiative to promote ICT as a driver for socio-economic growth across the continent. Rwanda is also a co-leader of the Northern Corridor Integration Projects ICT cluster, which brings together the governments of Rwanda, Uganda, Kenya, and South Sudan to collaborate in the development of the region.
For most other LDCs, several problems remain. Apart from Myanmar (see box above for more details on Myanmar), which has seen rapid changes in the sector as a result of policy reforms over the last two years, the gains made by LDCs were comparatively minor, resulting in in little or no movement up the index. Some reasons for this limited movement include existing legislation that is often not in line with international best practice, and limited or absent regulatory reform. While several LDCs have addressed long-standing issues around limited international bandwidth and have attracted greater investments in infrastructure, they are delaying critical reforms that can lead to lower industry costs and ultimately lower prices.
Working to reduce device costs
While our discussion thus far has centred around the cost of broadband data plans, there are other major expenses associated with accessing the Internet, including the cost to purchase and maintain an Internet-enabled device, and the cost of electricity needed to charge these devices.
Mobile phones represent the cheapest Internet-enabled device available on the market and, as a result, most people in developing countries will have their first broadband experience on a smartphone, and will use a mobile phone as their primary device for accessing the Internet. The GSMA estimates that by 2020, 63% of connections globally will be through a smartphone.
However, the relatively high cost of smartphones continues to prevent many people from getting online. Though our ADI analysis does not directly examine device costs, reducing the cost of mobile devices will be a critical aspect of expanding access and enabling billions of low-income users to afford both a device and a broadband data package.
The cost of smartphones in developing countries has fallen over recent years — since 2008, prices have dropped by 30% in Asia, 25% in Latin America and the Caribbean, and 20% in Africa. Nevertheless, the cost of an average smartphone still remains out of reach for many. The GSMA recommends7 that devices be priced between US$25-50 in order for the majority of people in developing countries to consider them affordable, yet smartphones on average cost over two times that recommended “sweet spot”. Most smartphones still sell for US$100 or more in developing countries — equivalent to approximately 9% of annual income (or about an entire month’s income) for a person living in poverty (i.e., on under $3.10/day).
Even where individuals might be able to afford a smartphone, they might not be able to afford the additional costs associated with a data plan (as evidenced by at least one mobile phone group in Africa). When we add the price of a hypothetical low-cost US$48 smartphone to the price of a 500MB broadband plan, we find that the total population in almost all countries that can actually afford both a broadband plan and a low-cost smartphone drops by 20% ( when compared with the percentage that can afford the broadband plan alone8). For some countries, such as India and Pakistan, affordability drops as much as 60% when device costs are included.
In recent years, a number of device manufacturers (e.g., Mozilla, Google/Android One, Gionee, Huawei, ZTE) have released low-cost smartphones in developing countries, including some that cost as little as US$25. Operators in low-income markets have also taken steps to make smartphones more affordable (e.g., MTN in South Africa). However, many of these efforts have had less success than expected. For some would-be consumers, the price of these “low-cost” options remain out of reach; for others, the “low-cost” smartphones available on the market lack the functionality and quality necessary to convince users to purchase the device.
Private sector efforts to bring desirable low-cost smartphones to market should be applauded, despite the mixed results. It is clear, however, that more can be done, especially with respect to the costs associated with accumulated patent royalties. Royalty stacking — where a company must pay multiple royalties because its device, or components within its device, might infringe on an existing patent — is a significant challenge in the smartphone industry. Recent analysis suggests that patent royalties contribute as much as US$124 to the total cost of a US$400 smartphone — a number that appears all the more disproportionate when one considers that the physical components of such a phone generally cost between US$120-$150. This highlights a clear opportunity to make smartphones more affordable. Indeed, royalty stacking in the smartphone industry undermines the competition, investment, innovation, and reduction in cost required to make devices affordable for the majority of people.
Governments also have a role to play. A large portion of the total cost of a smartphone results from import and sales taxes levied on the devices. Governments in some countries — most notably in Africa, where device costs have fallen least since 2008 — have recognised that reducing such taxes can lead to higher future tax revenues by boosting economic growth. Earlier this year, the government of Côte d’Ivoire, for example, took the bold decision to reduce taxation on smartphones from 26% to 6.6%. It is imperative that other governments take such steps and play their role in the proliferation of affordable smartphones.
2.5The long road to improved broadband affordability
Despite some progress made over the past year, there remains significant room for improvement across all of the countries of the ADI. This is even true for those countries that moved the most up the index, including Myanmar, Morocco, and Mexico. Where affordability of mobile broadband (as measured by price as a percentage of GNI per capita) has improved, it has done so only marginally; in some regions, mobile broadband has become less affordable, particularly for a 1GB plan9.
Figure 3. Average price of a 500MB (prepaid, mobile) broadband plan as a % of GNI per capita, by region
Figure 4. Average price of a 1GB (postpaid, computer-based) broadband plan as a % of GNI per capita, by region
2.6Increasing affordability by developing policies in line with best practices
The ADI assesses the progress that countries are making in implementing policies informed by a set of policy and regulatory best practices. In constructing the index, these policy variables are grouped into five clusters based on thematic similarities:
- Policy and regulation for competition
- National broadband planning
- Universal access
- Infrastructure sharing
- Spectrum policy
While the ADI provides an indication of the overall progress a country is making in promoting affordability, it can also be useful to look in more detail at which policy clusters countries are doing well in, and those clusters that require more work. Figure 5 illustrates the scores for select countries based on a series of surveys completed by policy experts in 201410. Policies were scored on a scale from 0 to 10, where 10 indicated that the policy was in line with international best practice and was being implemented on a wide scale.
Figure 5. Average Clustered Policy Scores for Select Countries (2014)
The above graph highlights the various policy areas where countries are doing relatively well, as well as those that require more attention. Colombia, for example, scored close to an eight for policies that support spectrum allocation, universal access, and broadband adoption — well above the average score (of 4.6) for all countries in the ADI. Nevertheless, Colombia still has much work to do to improve its policies around infrastructure sharing and competition, where it only scored around a six.
In other countries, the gaps between the policy clusters are much larger. Jamaica, for example, rates above average on spectrum and universal access policies, but needs to improve policy around infrastructure sharing. For countries at the lower end of the ADI rankings, the scores for each cluster are lower across the board. Though Malawi is rated just below the average for spectrum allocation policy, it urgently needs to improve its national broadband planning.
2.7Comprehensive approach to policymaking
Our assessment shows that no one policy domain had a greater influence than others on price, as a proportion of GNI per capita. This suggests that reforms and/or investments in just one domain are not enough to effect long-lasting change. Countries must develop policies and investments that will work together to build an affordable Internet environment. Focusing on supply while ignoring demand, for instance, is a recipe for failure. Although resource constraints typically mean not all policies can be implemented at once, policies should be developed with the end goal in mind, and should keep an awareness of the big picture and how all the pieces fit together.
3
Poverty, Income Inequality, and the Case of Mistaken Affordability
In 2011, the UN Broadband Commission established a target for for broadband affordability: entry-level broadband (defined as 500MB of mobile data) priced at 5% or less of average national income (as measured by GNI per capita). By early 2015, according to the ITU, 111 countries — including all of the world’s developed countries and 60% of developing countries — had achieved this target.
Our own analysis points to progress made over the past year. Our 2014-15 Affordability Report found that 23 out of 51 countries were able to meet the UN’s 5% price target; this year, 25 countries have met this target11, as shown in the table below. Of the 26 that have yet to meet the target, 16 are LDCs.
| Country | Mobile-broadband, prepaid handset-based (500 MB) as % of GNI per capita | Market penetration, unique subscribers (Mobile broadband) |
|---|---|---|
 Kazakhstan Kazakhstan |
0.57 | 15.49 |
| Turkey |
0.95 | 28.04 |
| Malaysia |
0.99 | 30.82 |
| Costa Rica |
1.03 | 39.08 |
 Indonesia Indonesia |
1.13 | 13.82 |
| Brazil |
1.13 | 35.47 |
 Pakistan Pakistan |
1.31 | 3.25 |
 Thailand Thailand |
1.38 | 38.67 |
| Mauritius |
1.43 | 25.24 |
 South Africa South Africa |
1.48 | 32.52 |
| VIEW MORE | ||
emerging
developing
However, while the past year has seen a decrease in broadband prices as a percentage of average income, these reduced prices have not translated into rapidly increasing rates of connectivity. On average, in 15 of the 25 countries that have met the 5% target, only one in five people (or fewer) are mobile broadband subscribers. A closer look at the levels of poverty and in-country income inequality helps to explain the reasons for slow connectivity growth, despite falling prices.
3.1The effect of poverty
Across the 51 countries covered in our report, there are 1.9 billion people living in absolute poverty (i.e., under the World Bank’s new poverty measurement of US$3.10/day); 835 million of these live in extreme poverty (i.e., under US$1.90/day). For these people, the price of a basic broadband connection represents a much higher proportion of income than for those earning the national average income.
| Country | Price of 500MB plan as a % of average income for those living on less than $3.10/day (US$94/month) | Poverty headcount ratio at $3.10 a day (2011 PPP) | Price of 500MB plan as a % of average income for those living on less than $1.90/day (US$58/month) | Poverty headcount ratio at $1.90 (2011 PPP) |
|---|---|---|---|---|
| Pakistan |
5.50 | 44.97 | 8.9 | 8.3 |
 Mozambique Mozambique |
6.60 | 87.54 | 10.7 | 68.7 |
 Bangladesh Bangladesh |
8.80 | 77.61 | 14.3 | 43.7 |
| Indonesia |
9.70 | 41.67 | 15.7 | 15.9 |
| Kazakhstan |
11.70 | 0.26 | 19.0 | 0.04 |
 India India |
12.00 | 58.01 | 19.5 | 21.3 |
| Costa Rica |
12.80 | 3.95 | 20.7 | 1.7 |
 Kenya Kenya |
13.40 | 21.8 | ||
 Tunisia Tunisia |
14.10 | 8.4 | 22.9 | 2.0 |
| Turkey |
15.20 | 3.1 | 24.7 | 0.3 |
| VIEW MORE | ||||
emerging
developing
Despite falling prices, not one of the 51 countries included in our analysis has met the 5% affordability target for those living in poverty. This is not an issue affecting small numbers of people — in the LDCs, over two-thirds of the population12 may be living beneath the international poverty line. Though the countries at the top of the table above have comparatively low broadband prices for those living in poverty, high levels of poverty persist and, as a result, mobile broadband subscription rates remain low (e.g., Pakistan and Bangladesh both around 3%, Mozambique at 7%). This suggests that even with low prices, significant populations in these countries will require alternative means, including public access options, to get online.
Building business solutions for low-income, rural customers in Benin
Developing sustainable business solutions to provide affordable Internet access for low-income customers can be a challenge, particularly in countries like Benin where 75% of the population lives in poverty (i.e., on less than $3.10/day).High infrastructure costs, for example, pose a significant barrier to the provision of mobile coverage in rural areas, and can reduce the possibility of much financial return on investment. To tackle this problem, MTN Benin and Ericsson have partnered on a five-year agreement to provide mobile access to rural, and often impoverished, communities in northern and central Benin, where coverage currently doesn’t exist.
The project, which launched in October 2015, has contributed to expanding connectivity by deploying both solar-powered base stations and satellite for backhaul connectivity. This implies lower supply-side costs, and a potentially sustainable business model that can bring the benefits of connectivity to those who need it most. As a result, customers in these areas have recently started using MTN Benin’s mobile money services.
3.2The distorting effect of income inequality
It’s not just the poorest of the poor who struggle with the cost to connect. Wide differences in earnings within individual countries also can mask the true affordability picture. The UN measures affordability by comparing broadband costs to an estimate of the average income in country (i.e., GNI per capita). Although simple and useful, this affordability yardstick smooths out the sharp income inequalities that exist on the ground in many of the countries covered in this report. To understand the true affordability picture we need to analyse broadband prices as a percentage of the income of the rich, the middle class, and the poor.
So, how affordable is Internet access when we take in-country income inequality into account? To get a clearer picture of affordability across a country’s full population, we analysed how expensive a 500MB package is for different income groups in each country ( divided into quintiles, or segments of 20%13). In most countries surveyed, even a basic monthly data allowance is not affordable to vast swathes of the population — one in five people are unable to afford such a basic connection in countries like Brazil and India; this rate spikes as high as four in five people in nations like Botswana and the Dominican Republic. We found that the 20% of the population with the lowest average income could only afford a basic data package in nine of the 36 countries (for which income distribution data was available).
| Countries where 500MB plan is affordable for bottom 20% | Mobile-broadband, price of prepaid handset-based (500 MB) as % of average income of bottom 20%, 2014 | Mobile-broadband, price of prepaid handset-based (500 MB) as % of national average income (GNI per capita), 2014 |
|---|---|---|
| Costa Rica |
4.85 | 1.03 |
| Indonesia |
2.81 | 1.13 |
 Jordan Jordan |
4.33 | 2.05 |
| Kazakhstan |
1.23 | 0.57 |
| Malaysia |
3.84 | 0.99 |
| Mauritius |
3.24 | 1.43 |
| Pakistan |
2.53 | 1.31 |
| Thailand |
3.46 | 1.38 |
| Turkey |
3.95 | 0.95 |
emerging
developing
In the other 27 countries, a basic broadband plan is not affordable for at least one quintile of the population. Of particular note are the nine countries — Brazil, India, Peru, Philippines, Mexico, South Africa, Colombia, Ecuador and Namibia — where a 500MB plan is ostensibly affordable using national average income (i.e., those countries that have met or surpassed the 5% target), but where the price exceeds the 5% target for some portion of the population. This finding points to the need for a lower target that takes in-country income inequalities into consideration.
While using incomes by quintile rather than the national average provides a more accurate picture of affordability, this data is not regularly updated or available for many countries. As a result, the national average income (i.e., GNI per capita) continues, for now, to be the best measure of progress. What then would be a better target for price as a proportion of GNI per capita — one which would make access affordable for all?
In countries where a 500MB plan is affordable for all income quintiles, price as a percentage of GNI per capita is less than 2% (Jordan is 2.05%). This is reflected in Figure 6, where these same countries are found below the red line marking prices at 2% or less of average income. In other words, when the price at the national level is lower (e.g., 2% of GNI per capita), that price also becomes much more affordable when we consider average incomes for each quintile within the population.
Figure 6. Comparison of price as a % of GNI per capita for a 500MB plan and the % of population that can afford that plan (2014)
emerging
developing
As long we keep using price as a percentage of GNI per capita to assess affordability, we need a lower target to overcome the effects of income inequality and achieve wider affordability. This new target should reflect our finding that entry-level broadband becomes affordable across all five income segments when priced at 2% or less of average monthly income. Accordingly, we propose that the ITU and its member states agree to adopt and work toward a new and ambitious target of broadband priced at or below 2% of GNI per capita.
3.3Hungry for data
While affordability is currently measured against the cost of a 500MB data plan, the reality is that users are hungry for more data and meaningful use of the Web requires it. With a data allowance of 500MB a month, you could only watch two minutes of high-quality video— not enough to enable regular use of health, education and other valuable online tools and information sources. Video and picture-rich content consume large amounts of data and yet, it is exactly these resources that are likely to be most valuable for the poor, marginalised, and often illiterate populations that are currently offline. A larger data allowance is needed for users to realise the development benefits of the Internet. Doubling the current 500MB yardstick to 1GB would be a good start.
Mobile data services designed to address the needs of low-income groups
Over the last few years, a number of initiatives designed to increase access, particularly among the poor and other under-represented populations, have sprouted. These initiatives typically centre around data service plans that offer content-specific, zero-rated data (i.e., data offered to users at no cost, but which can only be used to access specific sites or applications). To supporters, these zero-rated and similar services offer the promise of access — even if limited (in time or content) — to those who might not otherwise have a chance to come online. To critics, this sort of behavior offers users such limited Internet access that it threatens to create a two-tiered Internet — one for the rich, and one for the poor. Other models, which offer “free” data in exchange for completing certain tasks (e.g., watching an advertisement, completing a survey) are also emerging.
Despite the growing profile and debate around zero-rated and other mobile data services, there is a dearth of empirical evidence on the effectiveness of such services, making it difficult to develop informed recommendations on their use. A4AI recently started a research project to uncover the facts around the availability, use, and impact of these data service models in developing countries. Using empirical research, we will determine how service-specific, zero-rated, and other new data service models impact Internet affordability and usage in developing countries and in so doing, will inform policymakers on how best to address such services as part of their overall strategies to improve Internet access.
The project draws on user surveys and interviews with industry and government stakeholders, and will look at service use and impacts across eight developing countries (Colombia, Peru, Ghana, Nigeria, Kenya, India, Bangladesh, and the Philippines). The first research brief examines the types of mobile data services that are actually being offered in these countries; further research briefs will be published on an ongoing basis, as new data is collected and analysed.
3.4The long road to universal access in the world’s Least Developed Countries
While the price of an entry-level broadband plan has trended down across the globe, the average cost in developing countries is still squarely above the 5% target, coming in at an average of 6.5% of GNI per capita. The situation is even more dire in the majority of the world’s 48 Least Developed Countries (LDCs), where approximately half the population lives in extreme poverty.
Though broadband prices are falling faster in LDCs than across developing countries as a whole, the cost of a basic broadband plan — equivalent, on average, to 15.2% of GNI per capita — remains either unaffordable across all segments of LDC populations, or affordable only for the top 20% of income earners (Bangladesh is the exception, see Table 6). Across all LDCs in our study, approximately 340 million people — or 69% of the population — cannot afford a 500MB mobile broadband plan.
To achieve universal access across the LDCs by 2020 will require radical change, fast. The ITU estimates that at current rates, only 16% of people in LDCs will be online by 2020. Our own analysis shows that, at current rates, LDCs on average won’t achieve universal access (i.e., at least 90% Internet penetration) until 204214. How can we accelerate progress to consolidate 27 years worth of growth into just five years?
| Country | Estimated percent of population (based on number of income quintiles) that can afford a 500MB mobile broadband plan | Estimated population (based on number of income quintiles) than cannot afford a 500MB mobile broadband plan | Mobile-broadband, prepaid handset-based (500 MB) as % of national average income (GNI per capita) | Estimated number of years to reach 90% Internet penetration rate based on trends over last 15 years |
|---|---|---|---|---|
| Bangladesh |
80 | 31,815,503 | 3.49 | 25 |
| Rwanda |
20 | 9,073,235 | 14.02 | 27 |
| Tanzania |
20 | 41,458,097 | 10.54 | 30 |
 Zambia Zambia |
20 | 12,577,074 | 11.89 | 18 |
 Benin Benin |
20 | 8,478,786 | 12.3 | 35 |
 Senegal Senegal |
20 | 11,738,046 | 11.57 | 25 |
 Nepal Nepal |
20 | 22,539,779 | 7.45 | 15 |
| Uganda |
0 | 37,782,971 | 15.4 | 18 |
 Mali Mali |
0 | 17,086,022 | 17.04 | 28 |
 Burkina Faso Burkina Faso |
0 | 17,589,198 | 24.3 | 22 |
| VIEW MORE | ||||
emerging
developing
3.5Overcoming the challenges of poverty and income inequality
As this analysis shows, we have a long way to go to make basic Internet access truly affordable for all.
Whereas 25 of 51 countries had met the 5% affordability target for those earning the average national income, just nine of these countries meet the affordability target for the bottom 20% of its population. Not a single country studied can claim to meet it for those living in poverty.
Though prices continue to move lower and countries continue to achieve the UN 5% affordability target, the reality is that income inequalities belie the true nature of affordability on the ground. If broadband prices remain out of reach for large segments of the population in developing and emerging countries, so too will universal access remain an unachievable goal. So long as rampant poverty and inequality exist, a target that defines affordable Internet at 5% of average national income will keep billions locked out of the information economy.
Though reducing inequality in its broadest sense requires efforts beyond the scope of the Alliance, we can work with governments and stakeholders around the world to develop policies and initiatives that will enable us to overcome the access challenges posed by inequality.
We think that there are three key steps countries should be taking:
First, set a more ambitious affordability target. A top-line target is in many ways a necessary evil — a single number that all stakeholders can get behind. However, our analysis has shown that the current target of entry-level broadband priced at 5% or less of GNI is woefully inadequate. In the countries studied, only once prices drop to 2% of GNI per capita or below does basic broadband become truly affordable for all income groups, including the bottom 20%. As noted earlier, 500MB of data does not allow for meaningful use of the Internet; it is time to bring the standard by which we measure our progress on “affordability” more in line with the reality of modern data usage. We therefore propose a new definition of “affordable Internet”: A 1GB mobile, prepaid broadband plan priced at 2% or less of average monthly income. This “1 for 2” target should be adopted as the new threshold for affordability.
Second, get more granular on measuring affordability and uptake across different population groups. Universal access requires targeted strategies. Measuring how these strategies are working requires segmented analysis. Given the challenges of data collection and resource constraints in LDCs, this is a medium-term goal for governments to aim for, and for donors to support.
Third, commit to public access programmes to reach those that the market never will. Even at a level of 2% of GNI per capita, Internet access will remain out of reach for the poorest of the poor. Far flung rural areas may never prove profitable for operators to serve. Strategies such as public access programmes and mandatory service provision as a license condition should be included in national policies. Better use can be made of Universal Service and Access Funds (USAFs) — often maligned, but often effective — to achieve these goals.
These recommendations, and others, are considered in more detail in Section 5.
4
Gender Inequality: Exacerbating Affordability Challenges
As the 2014-15 Affordability Report found, women are among those hardest hit by the high cost to connect. A number of factors play into this reality, including cultural barriers to access (e.g., “a woman shouldn’t be online”) and many of the same economic challenges discussed above (in Section 3). As stark as the affordability picture appears for those living in poverty and at the bottom of the income pyramid, it is that much more dire for women in these income groups who, on average, earn 30-50% less than their male counterparts. This gender wage gap diminishes the ability of women — and female-headed households in particular — to afford Internet access.
The need for gender-specific thinking in development is explicitly recognised in the SDGs. In addition to calling for affordable, universal access to the Internet (target 9c), the new set of SDGs also propose, via target 5b, to “enhance the use of enabling technology, in particular information and communications technology, to promote the empowerment of women.” Although these two targets are found under different overarching goals, they are inextricably linked — universal access cannot be achieved without concrete efforts to bring women online, just as full gender equality cannot be achieved without enabling women’s access to an affordable, open, and safe Internet.
So what is the state of play for women and the Web, and what actions can be taken to enable more women to come online?
4.1Women and affordable access to the Internet: The current picture
I really want to learn how to use the Internet, but [mobile data] is still expensive, and there’s no free Wi-Fi access in my area – I would have to travel to a shopping mall to get Wi-Fi.”
Female shop-owner in Jakarta (From a focus group discussion by ICT Watch, Women’s Rights Online country partner)
Recent research by the Web Foundation shows that poor women in urban areas in ten developing countries are 50% less likely to be connected to the Internet than men in the same age group, with similar levels of education and household income. Two major barriers to women’s online access — as found by the Web Foundation research and earlier research by the GSMA — include both a lack of know-how or technical literacy, as well as the high cost to connect. Those countries that have the highest Internet costs (as a proportion of average income) not only have the lowest numbers of women online, but also the largest gender gaps in Internet use (see Figure 7). Using recent sex-disaggregated income data from ten countries in Latin America and the Caribbean, we found that the relative cost to connect is higher for female-headed households — perhaps not surprising given the gender wage gap found throughout the globe. The high cost to connect particularly affects single-parent, female-headed households, which comprise up to 25% of all households in those countries.
Figure 7. How mobile broadband prices affect women’s Internet access
emerging
developing
As a result of these barriers to connectivity, the GSMA estimates that 1.7 billion women in low- and middle-income countries do not own mobile phones. The same study finds that women on average are 14% less likely than men to own a mobile phone — a fact that translates into a gender gap in mobile phone ownership of 200 million. Working to close this gap will be an important element in working to close the overall gender digital divide.
The mobile phone gender gap in Myanmar
By March 2015, just over a year after liberalising their ICT sector, 40% of Myanmar’s population between the ages of 15-65 owned a mobile phone. Yet, women were 29% less likely to own a mobile phone than men. To understand the reasons for this gender gap in mobile phone ownership, GSMA and LIRNEasia conducted a qualitative study among 91 men and women in Yangon, Myanmar’s largest city, and Pantanaw, a small town in the southwestern part of the country.
The research showed that women in Myanmar play a prominent role in the management of household finances — even if they do not earn anything themselves — and are frequently involved in the financial decision to purchase a mobile phone for the family. Yet women’s access to this family mobile phone is often limited because the phone tends to travel outside the home, with the person who is deemed to need it the most. Since activities outside the home are more often undertaken by men, this mobile access and usage gender gap is exacerbated. As such, getting a second mobile phone into the household (which has a higher likelihood of staying inside the household) seems key to increasing women’s access and usage.
The top two reasons among women for not owning a mobile phone (lack of affordability or need) are connected. “Not needing” a mobile is relative to the cost-benefit trade-off of purchasing an additional phone for the household. Many women without a mobile phone said that they don’t “need” one because they do not leave the house for work or studies. Though many would like to have their own mobile, they felt that even if they did buy one, the top-ups would be unaffordable because they are either not earning an income, or are earning a lot less than the male household members. The clear preference for particular high-end brands of smartphones was also a factor, since many women were willing to delay the purchase until they could afford a particular brand.
In addition, many women do not see spending on mobiles as a priority compared to other more pressing needs of the household, partly as a result of having limited experience with mobile phones. Even among women who already use or own a mobile, many did not possess the skills or knowledge to expand their current use to potentially valuable data services and usually relied on others (primarily men) for instruction.
In Myanmar, closing the mobile gender gap and realising the associated social and commercial benefits will require stakeholders to focus on the two main barriers: 1) improving affordability and 2) increasing technical literacy.15
This case study was prepared by Ayesha Zainudeen and Helani Galpaya of LIRNEasia, based on findings from a GSMA Connected Women-LIRNEasia study on Mobile phones, internet, and gender in Myanmar.
4.2Using smart policy to close the gender digital divide and achieve universal, equal access
The benefits of connecting women are significant — the GSMA estimates that “achieving parity in ownership and use between men and women in low- and middle-income countries could bring socio-economic benefits, such as the availability of new education and employment opportunities, to an additional 200 million women….[and] unlock an estimated US $170 billion market opportunity for the mobile industry by 2020.”
Similarly, the potential for the Internet to support women’s empowerment is enormous: it can link women with economic opportunities, expand social capital and support networks, and amplify women’s voices on civic issues. But gender equality and female empowerment through ICTs, as proposed in SDG target 5b, will not become a reality until ICTs become more affordable and readily accessible to women. What can we do to achieve this?
4.2.1Increase collection and improve availability of gender-based indicators
Poor understanding of the reasons for the gender gap in Internet access, adoption, and appropriation result in large part from limited data on the topic. Few governments consider gender-based indicators when developing surveys or data collection tools and, as a result, few collect gender-disaggregated data on ICT use. This translates to few countries considering gender when drafting policy; as the Web Foundation’s 2014 Web Index showed, few countries have concrete, measureable policy targets for gender equity in their national ICT policies and broadband plans. As a UN expert task force on measuring ICT recently concluded, “When ICT data excludes data on women specifically, women become ignored in data and in policy.”
Policy solutions to overcome the gender ICT gap and enable wider broadband access must be rooted in country-specific knowledge and experience, and must take into account the social and economic realities of the country — including how gender inequalities determine women’s participation and engagement with technology. We know that the dimensions and determinants of women’s digital exclusion vary widely by country, but without data that looks specifically at how women access and interact with ICTs, the development of strong, effective policy — and the ability to measure progress toward policy goals — will remain a challenge.
The Partnership on Measuring ICT for Development has developed and shared guidance for improving these data collection efforts and ensuring that the data collected can be compared and analysed internationally. All countries must commit to collecting sex-disaggregated data and most importantly, to integrating a gender perspective in all measuring efforts by introducing gender indicators in their surveys and data collection activities.
In addition to national efforts to improve data collection and measurement, it is also important that research institutions and those involved in gender and ICT research efforts collaborate and coordinate efforts, so that new research efforts avoid duplication and complement existing and ongoing research efforts. New, gender-centred research will enable us to develop a better understanding of women’s Internet access and use, and to create the policy needed to address barriers to access faced by women.
4.2.2Develop & implement gender-responsive national broadband plans & policies
Despite efforts over the last decade (e.g., an early ITU initiative to develop a gender and telecommunications policy curriculum and train policymakers and regulators on the importance of gender analysis; research and policy advocacy work done by UN agencies and global NGOs working on issues around gender in ICT), very little progress has been made to integrate gender equality targets at the ICT sector policy level. More recently, the Broadband Commission Working Group on Gender was successful in adding a new gender target — gender equality in broadband access by 2020 — to its advocacy efforts; however, this effort has had limited practical support and, therefore, limited impact.
This trend is apparent also on a national level. Very few countries currently take a gender-focused approach to their policy development — only 10 out of 109 countries covered in the 2013 Broadband Commission Working Group on Gender Report have policies that include references to gender. Only seven of a small sample of 17 developing countries analysed in further detail for our own affordability research have broadband plans in place, and only two (Nigeria and Colombia) have plans that include specific targets for ICT gender equity, with budget allocated to achieve these targets.
Without a specific focus on gender equality goals, policies and national plans will continue to fail 50% of their population. Given the significant gaps in addressing gender equality goals through policy and plans across most countries, we recommend that all policymakers consider the elements listed below as they develop or update their broadband plans and/or national ICT policies.
Designing policies with women in mind: Making policies & plans more gender-responsive
- Ensure that all analysis conducted for the purposes of developing policies and plans integrate gender and gender considerations, from network deployment analysis to universal access strategies and priorities.
- Involve gender advocates and experts in the policy and planning process from the start to ensure women-centric policy development.
- Establish time-bound targets to achieve gender equality in access across all areas of policies and plans, from skills building to adoption and use.
- Consider allocating a percentage of the resources available to support women-centred activities, including resources to promote and support women ICT entrepreneurs, digital literacy training for women and girls, and targeted public access and other projects to support access and use for women and girls.
- Ensure that all skill building and training programmes are developed considering the needs of women and girls across all educational levels. These programmes should: consider what themes would be most relevant to participants; offer training opportunities for all levels, from basic skills to more advanced coding and design; consider the location of programmes and the gender of trainers.
- Establish quotas to ensure the equal participation of women and other marginalised groups in all programmes supported by national policies and plans, especially rural and poor populations.
Enabling Internet access and meaningful use for Nigeria’s women
Nigeria’s National Broadband Plan (2013-2018) envisions a highly connected society and views access to broadband as a key factor in facilitating socio-economic development for the country and its people. It commits the government to intensifying efforts for improving digital literacy and inclusion by using existing national assets for community access, and to advocate and demonstrate the benefits of broadband within the government and among the population. Furthermore, the plan aspires to close the gender gap in ICT by committing to “monitor specifically the number of women without access to the Internet; provide incentives for private educational centres and civil society organisations to train more women in the use of the Internet, and have dedicated centres at local government headquarters to serve as safe technology access centres for women. Courses on safe use of the Internet for girls will also be delivered using ICT.”
Girls and women in Nigeria are 40% less likely to have access to the Internet than men, and support from the government and private sector is critical in closing this gap. The Growing Girls and Women in Nigeria (G-WIN) programme, initiated through the Ministry of Communications and Technology, supports projects seeking to bridge the gender gap in digital access and empowerment, such as:
- Smart Woman Nigeria is an online network of women in Nigeria who receive important information about topics like health, education, and agriculture via their mobile phones. This initiative has enabled rural and less privileged women to access information to help them meet their socioeconomic needs (e.g., information about health, education, agriculture, etc.).
- Digital Girls ICT focuses on developing ICT interest and skills among secondary school girls through their participation in digital clubs that include exposure to cutting-edge training in ICT skills. Though women represent more than 50% of Nigeria’s population, they occupy fewer than 20% of ICT jobs in the country. Digital Girls Clubs encourage young girls to embrace ICT in order to bridge the existing digital divide between men and women.
- FMCT/Huawei 1000 Girls leverages a private-public partnership with an ICT company to train 1,000 girls in practical ICT skills and knowledge to increase employability.
4.2.3Support education and skill-building programmes with a focus on women and girls
Research has shown the importance of a comprehensive broadband strategy — and one that considers both the supply of and demand for broadband services — for increasing universal access to and use of affordable Internet. Yet, if these supply and demand strategies continue to ignore the unique barriers faced by women and girls, they will never achieve goals of universal affordable access. To achieve equal and universal access, it is critical that both national broadband plans and broader national and international ICT policies contain gender-specific, time-bound targets, and consider best practices to overcome the economic and socio-cultural barriers that women face in getting online. Without such deliberate intervention, grounded in a careful understanding of the economic, social, and cultural realities of women’s ICT access and use, policies run the risk of further entrenching the gender digital divide and reproducing offline gender inequalities online.
Access to education, and skill building and training opportunities, is key to support women’s effective participation in a digital society, and must be considered and integrated as part of a comprehensive strategy. Several initiatives have been launched to support technical skills development for women and girls, including Take Back the Tech (led by the Association for Progressive Communications), trainings for women by World Pulse, and several programmes led by Ghana KACE. Recent efforts by the African Technology Foundation (see box below) serve as a good example of the kind of activities and opportunities that policies should support and integrate into larger-scale educational efforts.
Technology bootcamp empowers young Tanzanian women
To address the gender digital divide16 and ensure that women are provided an opportunity to develop as successful entrepreneurs, the African Technology Foundation recently conducted the first in a series of technology bootcamps for women at the University of Dar Es Salaam, Tanzania. Implemented in partnership with the College of Information and Communication Technologies (CoICT) at the University of Dar Es Salaam, Buni Divas, and HelptoHelp, the bootcamp was designed to achieve the following:
- Give female students studying at higher education institutes in Tanzania computer skills trainings and an introduction to online learning tools to meet the needs of universities as well as future employers.
- Train young Tanzanian women to become Technology Ambassadors, who can teach basic computer skills to fellow students, as well as in their home and business communities, with a focus on expanding into rural communities.
- Encourage employers in Tanzania to increase their hiring quota for skilled women, and to design roles based on realistic workplace challenges.
Bootcamp participants were trained and then tested on their basic computing skills. They were introduced to various elements of basic computing, including word processing, presentation technologies, coding, and software development, and a number of women were invited to develop and present their ideas for potential new business start-ups.
This case study was prepared with inputs from the African Technology Foundation.
5
Policy Recommendations
The results from this year’s Affordability Drivers Index point to areas in which countries have made gains to lower broadband costs; more importantly, they also highlight areas for improvement. These improvements are imperative to achieve the global goal of universal access, and stated goals by many governments to improve broadband affordability and access. Yet, to realise these goals, countries must overcome barriers posed by income and gender inequalities. Below, we review our key recommendations for tackling these challenges and enabling equal, affordable access for all.
5.1Redefine “affordability” with income and gender inequalities in mind
A major challenge to achieving affordable, universal access is that the current definition of affordability does not allow us an accurate picture of the true cost of access across the globe. In 2011, the UN Broadband Commission put forward what is now the de facto definition of “affordable Internet”: the price of an entry-level broadband plan should be less than 5% of monthly average national income (i.e., GNI per capita). Different components of this definition are worth revisiting.
5.1.1Redefine “entry-level” broadband as a 1GB data plan
First, it is time to reconsider what is meant by an “entry-level” broadband plan. As we discussed previously, a 500MB mobile broadband plan for use over the course of a month — equivalent to about 16MB of data per day — is limiting. As the data requirements of applications continually increase, so too does the need for larger data packages. The content most useful to those currently offline, many of whom are illiterate or lack formal education, is often the content that requires the most data to access (e.g., audio/visual content, interactive health and education apps, etc.). To benefit from and use the Internet in a meaningful way, it is much more realistic to assess affordability based on the price of a 1GB mobile broadband prepaid plan. While this remains a bare minimum, it provides a more relevant starting point.
5.1.2Set a more ambitious cost target
It is also important to reconsider the 5% affordability threshold. Our analysis has revealed that at this level, broadband prices in many countries appear to be affordable, when, in fact, they are too expensive for a significant portion of the population. In many of the countries that have achieved the 5% target, entry-level broadband (500MB) is still too expensive for at least the bottom 20% of income earners in the country and often remains out of reach for all those except the top group of income earners.
Using national average income as a measurement of affordability is imprecise and disguises the challenges caused by high levels of income inequality. Despite this, using GNI per capita — data that is readily available — as a measurement tool for affordability will remain our best option for assessing progress, so long as more granular data (e.g., data aggregated by income quintiles) remains hard to come by. To stand a chance at achieving the universal, affordable access called for in SDG 9c, we must account for and overcome the barriers posed by poverty and income and gender inequality. To do this, we must lower the threshold for what we consider “affordable” Internet.
5.1.3Adopt and work toward a new “1 for 2” target
We propose defining affordability as an entry-level broadband plan (i.e., 1GB plan) priced at 2% or less of GNI per capita. If growth continues at current rates, the digital divide will continue to widen and achieving universal access by 2020 will be impossible. In fact, LDCs are on track to achieve universal access (defined as 90% Internet penetration) only in 2042. Redefining “affordable Internet” as 1GB of data priced at 2% or less of GNI per capita will move the target to a level where women, the poor, and other marginalised populations might be able to afford to access the Internet and join the digital revolution. International organisations, including the UN Broadband Commission and the ITU, as well as national governments around the world must adopt and start working toward this new, more ambitious target now.
5.2Reduce the cost of devices
The additional cost of a smartphone — even a low-cost smartphone — conspires to keep many others offline. When the price of such a device is added to the price of a basic broadband plan, the number of people across income quintiles that can afford access is dramatically reduced. Enabling more people to afford broadband will require bringing down the cost of smartphones and other ICT devices.
In order to bring more affordable smartphones to the market, different stakeholders have important roles to play. Handset manufacturers must continue to manufacture low-cost smartphones; some have taken important steps in this regard (e.g., Google’s Android One programme, Huawei low-cost products), but much more needs to be done to develop a wider range of phones within the range of prices the GSMA estimates to be affordable in developing countries (i.e., US$25-50). Previous failed forays into the market have underscored the importance of these phones having a functionality and design comparable to higher-end phones, so that consumers are inclined to purchase them. Manufacturers and mobile phone operators should also consider business models that would enable them to partner to offer lower-priced smartphones to consumers.
The private sector, government, and academia should also examine the challenges posed by and effects of royalty stacking in the smartphone industry. Observers suggest that up to 31% of the cost of a US$400 smartphone can be attributed to patent royalties17. Indeed, in some cases, the cost associated with patent royalties for a smartphone represent more than the cost of the phone’s physical components. This matter requires closer examination, especially because royalty payments act as a disincentive for potential new market entrants to invest, innovate, and compete in the smartphone industry — all prerequisites for affordable desirable smartphones.
Governments can also help drive down device costs by reducing import taxes on handsets and related items like SIM cards. The A4AI-Mozambique Coalition argued, in a study done on the existing ICT taxation regime in Mozambique, that reducing custom duties on handsets (as well as other devices and equipment) could increase GDP by approximately US$443 million over four years. This economic growth would result from the expected increased uptake in mobile phone and ICT use. Such actions are urgent in countries with high taxes levied on ICT imports and services, like in St. Lucia, where import duties and other taxes add up to a whopping 55%18, and in the Dominican Republic where handsets taxes represent 48% of the total cost of devices. It is important that governments work to identify and implement a balanced taxation regime for ICTs, and handsets in particular — one that does not emphasise short-term revenues at the expense of medium- to long-term economic impacts.
5.3Prioritise public access facilities
Even when device costs are reduced and data becomes more affordable, lack of income will remain a steep barrier to access for some marginalised groups. Public access initiatives are often critical to bringing connectivity to these groups, yet they are frequently neglected or excluded from policy in developing countries trying to achieve universal broadband. To achieve the SDG target of universal access, governments will have to invest much more in providing widespread low-cost or free public access facilities, designed particularly to reach women, rural dwellers, and those living in poverty.
Public access facilities — including telecentres, community centres, post offices, libraries, and public WiFi networks — provide the public with affordable or free access to computers, tablets, and other communication devices with an Internet connection. These facilities may also serve as anchor points for community WiFi systems and networks that can also reach those people with their own mobile and computing devices. Recent experiences with public WiFi networks in in Sri Lanka and in the city of Tshwane, South Africa illustrate how governments are sponsoring public access and providing a free data allowance to citizens. Brazil, Colombia, Mozambique, Sri Lanka, Philippines and India all offer examples of successful public access initiatives that have not only expanded access, but have also provided the opportunities for skills training needed for local communities to benefit from this access.
Public access facilities offer broadband-enabled services, but they also double up as entities that provide educational opportunities, digital literacy training and, in many cases, skill development and distance learning opportunities. A multi-year study in several low- and medium-income countries found that most users (62%) first used the Internet at a public access venue. The study also found that public libraries are particularly important for providing affordable access to underserved groups. However, public libraries and other public access facilities often remain underfunded or overlooked as a mechanism for providing affordable access.
Digital inclusion initiatives
A number of governments have made commitments to address digital inclusion, especially in rural areas. Examples include:
- The NBTC of Thailand allocated US$550 million from the country’s Universal Service and Access Fund (USAF) to extend connectivity to 70,000 villages and connect 2,300 community-based ICT centres to broadband services.
- Fiji’s telecentre model promotes Internet use in schools — both for students, during school hours, and for local communities after school hours.
- Free broadband access in all public libraries of Western Cape, South Africa has allowed students and community members who would not otherwise be connected to access the Internet.
- In 2015, the Philippines committed resources to establish free nationwide WiFi in sites like schools, hospitals, airports and public parks by 2016.
- In Mozambique, Community Multimedia Centres support digital inclusion by providing free and low-cost access and digital training programmes for communities.
One of the main challenges surrounding public access initiatives is an insufficient understanding of the strategies needed to create and sustain public access centres. Some potential areas for focus by policymakers include strengthening national and local knowledge on how to create sustainable public access venues, offering locally relevant content and services such as e-government services, providing continuous and relevant training for staff and users at these venues, and ensuring that public access venues have appropriate low-cost broadband connectivity options. The role of telecentres will continue to evolve as technology changes, but ensuring inclusive growth will continue to require government-led efforts to ensure the availability of digital tools for marginalised citizens.
One key option to address sustainability concerns is to strengthen the use of Universal Service and Access Funds (USAFs) to support the expansion and successful implementation of public access facilities. As we’ve noted inprevious research, USAFs can direct funding to where it will be most effective in closing digital gaps and enhancing demand, which in turn will accelerate “the virtuous cycle of broadband ecosystem expansion. As important collective investment mechanisms, USAFs are well positioned to invest in and support public access facilities to become the low-cost or free access option for the unconnected, and the effective use of such funds can support these efforts.
5.4Develop gender-responsive national broadband plans
Gender inequality represents one of the most critical challenges of our time. The gender gap in ICT access (as evidenced by the Web Foundation’s Women’s Rights Online report) is one such inequality, and addressing it will be crucial for achieving both SDG 9c (universal and affordable access) and SDG 5b (using ICTs to empower women). We cannot achieve universal access without bringing women (half the world’s population) online; likewise, women’s empowerment through ICTs will not happen without enabling women affordable access to the Internet. Ensuring that ICTs can support women’s empowerment while overcoming the gender gap in ICT access and use are goals that must be explicitly addressed by governments everywhere. Although both gender issues and ICTs impact all aspects of modern life, they rarely intersect at the policy level. As noted previously, there are very few national broadband plans that address gender issues. At the same time, there are very few national gender policies that discuss ICT access and use.
In the 2014-15 Affordability Report, we showed that effective broadband strategies (i.e., “strategies that consider both the supply of and demand for broadband services, and that reflect a partnership-based approach to decision-making and implementation”) were associated with lower broadband prices. Making such strategies more gender-responsive has the potential to improve affordability and access to broadband among women; this, in turn, can help reduce the gender gap. A gender-responsive broadband plan will consider existing gaps between men and women in terms of affordability and access, and will propose interventions with the potential to lead to equal outcomes for men and women.
Creating a gender-responsive Digital Agenda in the Dominican Republic
The Dominican Republic recently revived efforts to develop a national Digital Agenda, and has committed to developing the agenda with input from a series of public consultations. The A4AI-Dominican Republic Coalition spearheaded efforts to ensure that this Digital Agenda would be gender-responsive, taking into consideration the unique needs of, and barriers faced by women in the digital space. While the initial draft of the Digital Agenda acknowledged the Gender Equality Plan for the Information Society (PIOM-SI) (developed by the Research Center for Feminine Action (CIPAF) in collaboration with Dominican gender advocates), it did not integrate its recommendations across the policy’s action areas.
In September 2015, over 90 stakeholders from various government agencies of the Dominican Republic, the private sector, and civil society gathered in Santo Domingo for a workshop on how best to integrate gender across all five pillars of the proposed Digital Agenda — (1) infrastructure and access, (2) capacity development, (3) productive development and innovation, (4) e-government and digital services, and (5) enabling environment. These ideas were then shared during a public consultation. The workshop and consultation — a collaboration between the National Commission on for Information Society and Knowledge (CNSIC), CIPAF, Indotel, the Ministry of Women’s Affairs (Mesa de Género y Tecnologías) and A4AI — revealed enormous public support for an increased focus on gender equality in the policy. It also recommended a potential sixth pillar on gender and digital inclusion, with cross-cutting considerations for gender and socio-economic equality in the Information Society. Participants recommended that the new policy focus specifically on:
- Digital services designed for the information needs of women and girls;
- Infrastructure and access strategies that consider the barriers to access faced by poor women, especially in rural or remote areas;
- Capacity building and educational opportunities for women and girls across all sectors, from agriculture to the military; and
- Building support for women technologists.
The inputs and suggestions are currently being integrated into the working draft of the Digital Agenda, which should be submitted for approval by mid-2016. It is expected that the new Digital Agenda will reflect the vision and aspiration of all Dominicans, including women and girls.
There are a few nascent examples of countries working to make their national broadband plans more gender responsive. A4AI national coalitions are supporting efforts in the Dominican Republic — which is working to include gender concerns and targets in the country’s Digital Agenda (see box above) — and Mozambique, which is working with the support of Cetic.br — the UNESCO Regional Centre for Studies on the Development of the Information Society — to collect more gender data by including new gender-based indicators and gender-specific questions in the country’s new household ICT survey. In order to develop a more general set of recommendations for other countries, we draw on these experiences and previous work in this area to put forward a checklist of issues that national broadband plans and sector policies should incorporate when looking to close the gender digital divide. Implementing these plans can also help countries achieve international and national targets to reduce the gender access gap and empower women.
Table 8. Developing gender-responsive ICT policy and broadband plans
| Digital Inclusion at the Core: Checklist for ICT Policy and Broadband Plans | |
| Overall | National level objectives for gender equity targets across key areas of the broadband ecosystem |
| Investment in the Sector (by private, public and public-private partnerships) |
|
| Availability (Supply) |
|
| Relevance (Demand) |
|
| Affordability |
|
| Measuring progress |
|
| Note: This is not a complete list, but rather a suggested checklist of some key elements to consider to ensure policies and plans are more gender-responsive | |
5.5Integrated approach to policies for affordable broadband Internet
Our analysis of countries’ performance on the Affordability Drivers Index, particularly in terms of policy scores, found that no particular set of policies (e.g., policies around competition, infrastructure sharing, universal access, spectrum policies, etc.) were more likely than another to lead to lower broadband prices. Policies across all these areas are important in lowering industry costs and broadband prices. This points to our final recommendation — to address many of the challenges discussed above, governments and their partners in the private sector and civil society need to employ a comprehensive approach to creating affordable broadband Internet.
Our 2014-15 Affordability Report offered a roadmap towards improved affordability using a similar multi-pronged approach that promotes competition, open access and infrastructure sharing, access to spectrum, and universal access. We would add that it is also important to ensure that these policies are connected to related policies dealing with specific challenges such as gender inequality, income inequality, or poverty.
This is even more relevant in light of the role broadband Internet plays in helping to achieve many of the proposed SDGs. A comprehensive approach can extend beyond specific sectoral objectives and can be part of a country’s broader development agenda. The 2016 World Development Report notes that for countries to fully realise ICT-supported development goals they must also invest in relevant and complementary non-ICT initiatives, including policies around skills development (e.g., education and training), accountability (e.g., good governance), and competition (e.g., anti-trust laws). Of course, all of this will require investment. Donor agencies and governments must support this by stepping up investment in broadband infrastructure and low-cost connectivity models, as well as in digital skills, local content development, and public access initiatives. A comprehensive approach to broadband policy will incorporate the assumptions and goals of a range of other policies and ideally will be part of a multi-sectoral debate on achieving more affordable broadband.
6
Annexes
6.1Acknowledgements
Research and analysis for the 2015-16 Affordability Report was led by Dhanaraj Thakur. The report was written by Dhanaraj Thakur, Sonia Jorge and Lauran Potter, with contributions from Kojo Boakye, Onica Makwakwa, Ingrid Brudvig, and Shaddy Shadrach. Dillon Mann and Anne Jellema provided valuable advice and editorial support.
The Affordability Drivers Index research was carried out by Hania Farhan and Siaka Lougue (African Institute of Mathematical Sciences). A wide range of experts were involved in validating and reviewing the primary research conducted last year, and others helped to develop various case studies and best practice examples highlighted throughout the report; we thank them for their contribution.
The A4AI Affordability Working Group — composed of member representatives from the Association for Progressive Communications, Cisco, DIRSI, Ericsson, Facebook, Google, LIRNEasia, the Internet Society, Microsoft, Nokia, Omidyar Network, Research ICT Africa, USAID, World Pulse, and the Web Foundation — provided valuable inputs and advice on earlier drafts, although any errors in this draft remain ours alone.
Finally, we are grateful for the support of A4AI’s global sponsors — Google and USAID — and that of the Alliance’s entire membership.
6.2Annex A: Methodology
The Affordability Drivers Index (ADI) is a composite measure that summarises in a single (average) number an assessment of the drivers of Internet affordability in various countries. Benefiting from the research framework established by the Web Index, the ADI covers 51 countries and focuses on two key aspects driving affordability: communications infrastructure and access.
6.2.1Methodology
Two types of data are used in the construction of the Index: existing data from other data providers (“secondary data”), and new data gathered via a multi-country expert researcher survey (“primary data”).
The survey consists of a set of questions — scored on a scale of 0 – 10 — on issues regarding policy, regulation, and various other aspects around broadband and affordable access to the Internet. The questions were specifically designed by the Alliance for Affordable Internet, the Web Foundation, and its advisers. These primary data, based on and aligned with the A4AI Best Practices, attempt to assess the extent to which countries have achieved a policy and regulatory environment that reflects the best practice outcomes. Survey questions were scored based on predetermined criteria by country experts. Three country experts were asked to provide evidence and justification that supports each score. The scores were checked and verified by a number of peer and regional reviewers.
The policy surveys were completed in 2014. We decided not to conduct a new set of surveys for 2015 on the assumption that policies and the regulatory environments of each country have not changed significantly, if at all, over the last year for most countries. To ensure that this was the case we asked several of the policy experts to review their survey responses for their assigned countries and compare those to the national policy and regulatory environments in 2015. In most cases, their responses were similar to those of 2014, although some noted that new laws or regulations are expected to be completed in 2015 which will take effect next year.
6.2.2Data sources and data providers
We employed data from several large international databases to measure or proxy the dimensions under study. Before an indicator is included in the Index, it needs to fulfill five basic criteria:
- Data providers have to be credible and reliable organisations, which are likely to continue to produce these data (i.e., it is not a one-off dataset publication).
- Data releases should be regular, with new data released at least every three years.
- There should be at least two data years for each indicator, so that a basic statistical inference could be made.
- The latest data year should be no older than three years back from publication year.
- The data source should cover at least two-thirds of the sample of countries, so that possible bias — introduced by having a large number of indicators from one source that systematically does not cover one-third or more of the countries — is reduced.
All the indicators included in the ADI are listed in Table 8 where they are grouped by sub-index and type (primary sources or secondary sources). There are two distinct types of indicators: primary and secondary. The primary indicators (codes A1-A13) are collected via the policy surveys described earlier. The secondary sources included data collected by the ITU, GSMA Intelligence, and the World Bank.
The indicators used in the ADI represent a comprehensive set of factors that influence broadband affordability. However, this is not a complete list as there may be other important factors which cannot be included because they do not meet the criteria above. In such cases, we conduct supplementary analyses to the index as we have done in this year’s report by looking at income and gender equality.
| Code | Type | Name |
|---|---|---|
| Access | ||
| A4 | Primary | ICT regulatory decisions informed by adequate evidence |
| A5 | Primary | Clear, time-bound targets in Nat’l Broadband Plan for reducing cost & increasing penetration |
| A11 | Primary | To what extent have Universal Access/Service Funds (USF) prioritised infrastructure investments that will reduce costs and increase access for underserved communities and market segments? |
| A12 | Primary | USFs used to subsidise access for underserved & underprivileged populations |
| A2 | Primary | To what extent does the gov’t ICT regulator perform its functions according to published and transparent rules, with the ICT regulatory decisions influenced by public consultations? |
| A13 | Primary | Specific policies to promote free or low-cost access |
| WI | Secondary | Market Concentration – Herfindahl Index (HHI) |
| ITU_K | Secondary | Existence of National Broadband Plan |
| ITU_B | Secondary | Broadband subscribers (per 100 people) |
| VIEW MORE | ||
6.2.3Index computation
There are several steps in the process of constructing a composite index. Some of those involve deciding which statistical method to use in the normalisation and aggregation processes. In arriving at that decision, we took into account several factors, including the purpose of the Index, the number of dimensions we were aggregating, and the ease of disseminating and communicating it in an understandable, replicable, and transparent way.
The following seven steps summarise the computation process of the Affordability Drivers Index:
- Take the data for each indicator from the data source for the 88 countries covered by the Web Index for the 2007-2014 time period. Impute missing data for every secondary indicator for the sample of 88 countries over the period 2007-2014. Some indicators were not imputed, as it was not logical to do so. None of the primary data indicators were imputed. Hence, the 2015-16 Affordability Drivers Index is very different from the 2007-2014 Indexes that may be computed using secondary data only. Broadly, the imputation of missing data was done using two methods, in addition to extrapolation: country-mean substitution if the missing number is in the middle year (e.g., have data for 2009 and 2011, but not for 2010), or taking arithmetic average growth rates on a year-by-year basis. For the indicators that did not cover a particular country in any of the years, no imputation was done for that country/indicator.
- Normalise the full (imputed) dataset using z-scores (z=(x-mean)/standard deviation), making sure that for all indicators, a high value is “good” and a low value is “bad”.
- Where applicable, cluster some of the variables (as per the scheme in the tree diagram), taking the average of the clustered indicators post-normalisation. For the clustered indicators, this clustered value is the one to be used in the computation of the Index components.
- Compute the two sub-index scores using arithmetic means, using the clustered values where relevant.
- Compute the min-max values for each z-score value of the sub-indices, as this is what will be shown in the visualisation tool and other publications containing the sub-index values (generally, it is easier to understand a min-max number in the range of 0 – 100 rather than a standard deviation-based number). The formula for this is: [(x –min)/(max – min)]*100.
- Compute overall composite scores by averaging the sub-Indexes (at z-score level).
- Compute the min-max values (on a scale of 0-100) for each z-score value of the overall composite scores, as this is what will be shown in the visualisation tool and other publications containing the composite scores.
6.2.4Income inequality and affordability
In order to better understand how many persons in a given country can actually afford a mobile broadband package, we can use average incomes broken down by population segments, rather than a single national average. One approach is to rank everyone based on their estimated income and then group the entire population into five equal groups (or quintiles). Persons in the top quintile would earn the most on average, while those in the lowest quintile earn the least on average.
The World Bank’s World Development Indicators Database provides the income shares of all quintiles for most of the countries covered in the Affordability Report. With this data we can estimate the average income for each quintile and use that instead of a single national average income (a similar approach based on income deciles was done in the ITU’s Measuring the Information Society Report 2014 using older data).
From this analysis we can get an approximation of the total number of quintiles for which a 500MB package is affordable based on the threshold of price less than 5% of average monthly income. To do this we sum the number of quintiles (each 20% of the population) where prices (in PPP) are less than 5% of average monthly income (in PPP) for that quintile.
As an illustration, in Malaysia the price of a 500MB mobile broadband prepaid plan in 2014 was US$8.56 (or $17.61 PPP), which was only 0.99% of the national average monthly income — well below the UN 5% target. If we look at incomes by quintile, this price increases to 3.85% of the average monthly income of those in the bottom 20%, meaning that it’s affordable for all five income groups.
We must point out that this analysis can only lead to approximations at best, as they are based on estimates of income shares, which are from 2013 to 2009. As our income and pricing data are from 2014 we make the assumption that income distributions have not improved significantly in the last one to five years.
6.3Annex B: Affordability Drivers Index – Emerging countries
Note: As of July 2015, the World Bank classifies Argentina and Venezuela as high-income countries; they remain included in this table for comparison.
| Rank | Country | Sub-Index: Communications Infrastructure | Sub-Index: Access and Affordability | Affordability Drivers Index: Overall Composite Score |
|---|---|---|---|---|
| 1 | Colombia |
60.85 | 69.45 | 65.32 |
| 2 | Costa Rica |
50.00 | 78.88 | 64.60 |
| 3 | Malaysia |
56.69 | 69.57 | 63.28 |
| 4 | Turkey |
58.60 | 65.85 | 62.35 |
| 5 | Peru |
61.48 | 61.93 | 61.82 |
| 6 | Brazil |
60.35 | 59.28 | 59.90 |
| 7 | Mauritius |
44.81 | 65.58 | 55.20 |
| 8 | Mexico |
51.05 | 56.68 | 53.85 |
| 9 | Argentina |
49.58 | 57.16 | 53.35 |
| 10 | Thailand |
44.13 | 60.72 | 52.39 |
| VIEW MORE | ||||
6.4Annex C: Affordability Drivers Index – Developing countries
| Rank | Country | Sub-Index: Communications Infrastructure | Sub-Index: Access and Affordability | Affordability Drivers Index: Overall Composite Score |
|---|---|---|---|---|
| 1 | Morocco |
49.32 | 61.67 | 55.51 |
| 2 | Rwanda |
51.90 | 54.42 | 53.13 |
| 3 |  Nigeria Nigeria |
47.93 | 57.83 | 52.85 |
| 4 | Uganda |
42.44 | 56.53 | 49.40 |
| 5 | Gambia |
42.81 | 49.12 | 45.82 |
| 6 | Kenya |
39.27 | 52.00 | 45.48 |
| 7 |  Viet Nam Viet Nam |
32.33 | 56.74 | 44.37 |
| 8 | Pakistan |
44.97 | 43.60 | 44.11 |
| 9 |  Ghana Ghana |
38.92 | 47.15 | 42.84 |
| 10 | Myanmar |
53.67 | 31.88 | 42.57 |
| VIEW MORE | ||||
6.5Annex D: ADI score and broadband price comparisons
| Country | ADI Score (2015) | Price of mobile-broadband prepaid (500MB) as % of GNI p.c. 2014 | Price of mobile-broadband postpaid plan (1GB) as % of GNI p.c. 2014 |
|---|---|---|---|
| Kazakhstan |
36.5 | 0.57 | 0.57 |
| Turkey |
62.3 | 0.95 | 1 |
| Malaysia |
63.3 | 0.99 | 1.69 |
| Costa Rica |
64.6 | 1.03 | 1.61 |
| Brazil |
59.9 | 1.13 | 2.31 |
| Indonesia |
42.2 | 1.13 | 1.56 |
| Pakistan |
44.1 | 1.31 | 10.47 |
| Thailand |
52.4 | 1.38 | 2.49 |
| Mauritius |
55.2 | 1.43 | 0.82 |
| South Africa |
46.4 | 1.48 | 1.18 |
| VIEW MORE | |||
emerging
developing
Notes
- For purposes of this report, we define “universal access” as an Internet penetration rate of 90%. This definition draws on the WSIS declaration, which defines universal access as “Universal, ubiquitous, equitable and affordable access to ICT infrastructure and services”.
- Throughout this report, all price measurements for 500MB plans are for prepaid, mobile plans (unless otherwise noted). All price measurements for 1GB are for postpaid, computer-based plans (unless otherwise noted).
- GSMA Intelligence Database (2015)
- GSMA Intelligence Database (2015)
- GSMA Intelligence Database (2015)
- The UN periodically reviews which countries can be classified as a LDC based on several socio-economic factors. There are currently 48 such countries, 18 of which are included in the ADI (based on the availability of data).
- GSMA Intelligence Database (2015)
- Under this scenario the smartphone would add US$4/month to the overall user’s cost.
- Note that little or no improvement in affordability between 2013 and 2014 can be explained in part by declines in average GNI per capita across almost all regions (except Europe and the CIS). However, average prices (in PPP) also increased in this period, most notably for the 1GB plan in Africa and the Arab States.
- These surveys were completed for the 2014-15 Affordability Report.
- This refers to countries for which data is available.
- In Mozambique, 88% of the population lives on less than $3.10 a day; Bangladesh has 78% in poverty; Gambia has 68%. (World Bank (2015). Poverty & Equity Data. http://povertydata.worldbank.org/poverty/home/)
- For more detail, see Annex 1.
- Source data from the ITU World Telecommunications/ICT Indicators Database (2015)
- Zainudeen, Z. A., & Galpaya, H. (2015). Report of a joint GSMA Connected Women-LIRNEasia study on Mobile phones, internet, and gender in Myanmar (Rep.). London: GSMA
- Prepared with inputs from the African Technology Foundation.
- A4AI calculations based on Armstrong, Anne, Joseph H. Mueller and Timothy D. Syrett (2014), The Smartphone Royalty Stack: Surveying Royalty Demands for the Components Within Modern Smartphones.
- Saint Lucia figure provided by the Director of IT Services for the government of St. Lucia at a recent workshop attended by an A4AI member.
Related posts:

 Internet shutdowns cost countries $2.4 billion last year
 Uganda’s natives are becoming more powerless; losing land everyday, says a New Research Report
 Rights and Resources Initiative (RRI) launched a new report looking at 80 legal frameworks
 Activists express pessimism over government’s move to provide free Internet to Kampala and Entebbe dwellers
DEFENDING LAND AND ENVIRONMENTAL RIGHTS
Breaking: Witness Radio and Partners to Launch Human Rights Monitoring, Documentation, and Advocacy Project Tomorrow.
Related posts:

 Kiryandongo leadership agree to partner with Witness Radio Uganda to end rampant forced land evictions in the district.
 Human Rights Defenders not safe in Uganda – Unwanted Witness report
 Breaking Alert: Uganda passes the National Action Plan (NAP) on Business and Human Rights
DEFENDING LAND AND ENVIRONMENTAL RIGHTS
Kiryandongo leadership agree to partner with Witness Radio Uganda to end rampant forced land evictions in the district.

By Witness Radio team.
Kiryandongo district leaders have embraced Witness Radio’s collaboration with the Kiryandongo district aimed at ending the rampant violent and illegal land evictions that have significantly harmed the livelihoods of the local communities in the area.
The warm welcome was made at the dialogue organized by Witness Radio Uganda, Uganda’s leading land and environmental rights watchdog at the Kiryandongo district headquarters, intended to reflect on the plight of land and environmental rights defenders, local and indigenous communities and the role of responsible land-based investments in protecting people and the planet.
Speaking at the high-level dialogue, that was participated in by technical officers, policy implementers, religious leaders, leaders of project affected persons (PAPs), politicians, media, Civil Society Organizations (CSOs), and development partners that support land and environment rights as well as the Land Based Investments (LBIs) Companies in the Kiryandongo district, the leaders led by the District Local Council 5 Chairperson, Ms. Edith Aliguma Adyeri appreciated the efforts taken by Witness Radio organization to organize the dialogue meeting aimed at bringing together stakeholders to safeguard community land and environmental rights in order address the escalating vice of land grabbing in the area.
During the dialogue, participants shared harrowing accounts of the impacts of land evictions and environmental degradation, including tragic deaths, families torn asunder, young girls forced into marriage, a surge in teenage pregnancies, limited access to education, and significant environmental damage which have profoundly affected the lives of the local population in Kiryandongo.

Participants attending the dialogue.
In recent years, Kiryandongo district has been embroiled in violent land evictions orchestrated to accommodate multinational large-scale agriculture plantations and wealthy individuals leaving the poor marginalized.
According to various reports, including findings from Witness Radio’s 2020 research Land Grabs at a Gun Point, the forceful land acquisitions in Kiryandongo have significantly impacted the livelihoods of local communities. It is estimated that nearly 40,000 individuals have been displaced from their land to make room for land-based investments in the Kiryandongo district. However, leaders in the district also revealed in the dialogue that women and children are affected most.
The Kiryandongo Deputy Resident District Commissioner, Mr. Jonathan Akweteireho, emphasized that all offices within the Kiryandongo district are actively involved in addressing the prevalent land conflicts. He also extended a welcome to Witness Radio, acknowledging their collaborative efforts in tackling and resolving land and environmental issues in the district.
“Ladies and gentlemen, we all know that the land rights together with environmental rights have been violated in our district, but because we don’t know what our rights are, because we have not directly done what we could to safeguard our rights and now this is the time that Witness Radio has brought us together to safeguard our rights. I want to welcome you in Kiryandongo and be rest assured that we shall give you all the necessary support to help us manage these rampant cases,” Ms. Adyeri said in her remarks during the dialogue meeting.
The team leader at Witness Radio Uganda, Mr. Geoffrey Wokulira Ssebaggala expressed gratitude to the participants for their active involvement in the dialogue and revealed that Witness Radio’s objective is to find a holistic solution to the escalating land disputes in Kiryandongo district serving as an example to other districts.
“We are here to assist Kiryandongo district in attaining peace and stability because it stands as a hotspot for land grabbers in Uganda. Mismanagement of land conflicts in Uganda could potentially lead to a significant internal conflict. Everywhere you turn, voices are lamenting the loss of their land and property. Kiryandongo, abundant with ranches, suffers from a lack of a structured framework, which amplifies these land conflicts. The influx of wealthy investors further complicates the situation,” Mr. Ssebaggala disclosed.
Within the dialogue, Mr. Ssebaggala emphasized the need for the Kiryandongo district council to pass a by-law aimed at curbing land evictions as an initial step in addressing the prevalent land injustices.
Related posts:

 Why Are Evictions Still Happening In Kiryandongo: Witness Radio Petitions Government.
 Uganda: Targeting community land and environmental defenders with criminal offenses is rising as two community land rights defenders arrested in a hotspot district of forced land evictions.
 The Executive Director of Witness Radio Uganda talks about the role played by Witness Radio in protecting communities affected by large-scale agribusinesses in Kiryandongo district in an interview with the ILC.
Related posts:

 Witnessradio.org’s Petition to Land Inquiry Commission over Human rights in Kiryandongo district
 Kiryandongo District Authorities are on spot by the commission of inquiry into land matters
 Land grabs victims in Uganda meet amid escalating cases of illegal evictions and rights violations
Uganda: Targeting community land and environmental defenders with criminal offenses is rising as two community land rights defenders arrested in a hotspot district of forced land evictions.
Land grabs victims in Uganda meet amid escalating cases of illegal evictions and rights violations
Uganda: Targeting community land and environmental defenders with criminal offenses is rising as two community land rights defenders arrested in a hotspot district of forced land evictions.

Campaign Victory: World Bank Suspends Funding for REGROW, a Conservation Project Responsible for Evictions & Human Rights Abuses in Tanzania

A new wave of land grabs strikes Tanzania

The Roundtable on Sustainable Palm Oil explained: a primer for community organisations

US Luxury Safari Operator Tightens Stranglehold Over Maasai Land in Tanzania

Oil project-affected persons express disappointment in Uganda judiciary

100 years of Total Energies – a dark legacy

Chip in to take Bayer down!

How Kiryandongo land conflict has affected children

Innovative Finance from Canada projects positive impact on local communities.
Over 5000 Indigenous Communities evicted in Kiryandongo District
Petition To Land Inquiry Commission Over Human Rights In Kiryandongo District
Invisible victims of Uganda Land Grabs
-
 NGO WORK6 days ago
A new wave of land grabs strikes Tanzania
-

 MEDIA FOR CHANGE NETWORK1 week ago
Ugandan Activists Face Criminal Charges Following Pipeline Protest
-
 NGO WORK1 week ago
US Luxury Safari Operator Tightens Stranglehold Over Maasai Land in Tanzania
-

 MEDIA FOR CHANGE NETWORK1 week ago
Insurance firms should shun the East African Crude Oil Pipeline
-
 NGO WORK6 days ago
The Roundtable on Sustainable Palm Oil explained: a primer for community organisations
-
 NGO WORK2 days ago
Campaign Victory: World Bank Suspends Funding for REGROW, a Conservation Project Responsible for Evictions & Human Rights Abuses in Tanzania